Investment Strategy Through Visualization of Historical Data Patterns of Rapidly Rising and Falling Stocks date
This project aims to establish an efficient investment strategy by analyzing the historical data patterns of rapidly rising and falling stocks. Rapidly rising and falling stocks exhibit significant volatility in the stock market, allowing investors to experience high profits or losses. In this project, we utilized R to analyze the historical data of these volatile stocks and visualize them to provide strategic investment insights.
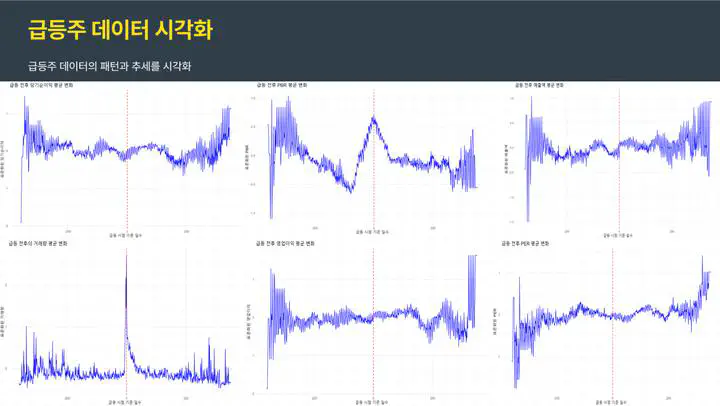
Historical Data Analysis: Collected historical stock price data of rapidly rising and falling stocks to identify patterns at specific points in time and visually represented them.
Pattern Visualization: Used R to graph the price fluctuation patterns of each stock, enabling a visual analysis of the price trends.
Data analysis and visualization using R play a crucial role in analyzing trends in large datasets. Specifically, in this study, we leveraged powerful R libraries such as ggplot2 and dplyr to visualize complex data in an easily understandable manner.
Key Project Results
For Rapidly Rising Stocks: PBR Surge: Purchasing at the initial stage when the Price-to-Book Ratio (PBR) sharply increases may be advantageous, as it indicates a high likelihood of further price surges. Increased Trading Volume: Considering purchase points when trading volume rapidly increases alongside stock price rises can be beneficial.
For Rapidly Falling Stocks: PBR Drop: Selling at the point when PBR sharply decreases is advisable, as it suggests a high likelihood of further price declines. Decreasing Trading Volume: Considering sell points when trading volume decreases and stock price begins to fall can help mitigate losses.
Limitations Historical Data Constraints: Since the analysis is based on historical data, there is no guarantee that future market conditions will replicate past patterns. External factors such as market volatility, economic events, and political changes can significantly influence outcomes.
External Factors Consideration: When applying visualized patterns to actual investments, it is essential to consider various external factors, including current market conditions and economic indicators.
Sample Limitations: The analysis focused on data from a specific period, which may limit the generalizability of the identified patterns beyond this timeframe.
KANG GUN WOO
student
I am double majoring in Statistics and Computer Engineering at Chonbuk National University.
Currently, my grades are in the 4-point range, focusing my studies on data analysis, programming, algorithms, and databases.
Through this, I am building a foundation in backend development and artificial intelligence.
I have experience conducting securities data analysis and web development projects using Python, R, and JavaScript.