Investment Strategy Through Financial Data Analysis and Visualization of Furniture Industry Companies date
This project aims to provide effective investment strategies to investors by analyzing the sales and net profit margins of companies in the furniture industry. Using R, we collected the financial data of companies belonging to the furniture sector and visualized it to assess the investment potential of each stock.
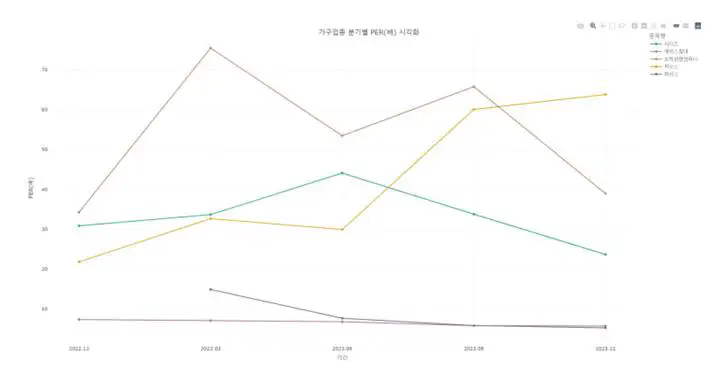
Corporate Financial Data Analysis: Compared and analyzed various financial indicators such as sales, net profit margins, and PER of different companies in the furniture industry to identify differences between stocks.
Visualization: Utilized R’s ggplot2 and plotly libraries to graphically represent changes in sales and net profit margins, assisting investors in easily interpreting the data.
Establishing Stock Selection Criteria: Based on the analyzed data, identified undervalued companies and selected promising investment stocks using PER (Price-to-Earnings Ratio) as a criterion.
Key Project Results
Visualization of Sales and Net Profit Margins: The visualization of changes in sales and net profit margins of furniture industry companies revealed that Peris exhibited the most stable growth, recording positive performance in both sales and net profit margins. PER Analysis: Peris had a PER of 6.69x, indicating that it was undervalued compared to other companies in the furniture industry. This means that its stock price is evaluated lower relative to its earnings per share. Investment Potential: Further analysis showed that as of the project completion date on May 16, 2024, Peris’s stock price was KRW 38,900. Within less than a month, it reached a peak of KRW 55,900, demonstrating an approximate 43.76% increase in value.
KANG GUN WOO
student
I am double majoring in Statistics and Computer Engineering at Chonbuk National University.
Currently, my grades are in the 4-point range, focusing my studies on data analysis, programming, algorithms, and databases.
Through this, I am building a foundation in backend development and artificial intelligence.
I have experience conducting securities data analysis and web development projects using Python, R, and JavaScript.